
Cardiac • 12-Lead ECG
Systematic 12-Lead ECG Interpretation: 8-Step Approach
Use the same systematic 12-lead ECG interpretation sequence every time: rate and rhythm, P waves, PR interval, QRS, axis, ST/T changes, QT/QTc and clinical correlation. This is one structured example you can use as-is or adapt.
Quick Jump
8 steps • same order • every timeThe 8-Step Approach
Pattern + contextWork left-to-right through the 12-lead, confirm calibration, and repeat the same sequence each time. If something is abnormal, interpret it in context (lead territory, symptoms, vitals, history).
1) Rate and Rhythm
Start here- Ventricular rhythm: regular or irregular?
- Ventricular rate: estimate from R–R interval (or use machine rate as a cross-check).
- Atrial rhythm: regular P–P activity present?
- Atrial rate: if P waves are visible, estimate P–P rate.
- Relationship: is there a consistent P before each QRS (1:1), or AV dissociation?
2) P Waves and PR Interval
Sinus check- P wave presence: are P waves visible? Are they consistent?
- Sinus check: P wave typically upright in lead II and inverted in aVR (pattern matters).
- P duration: usually < 120 ms (3 small squares at 25 mm/s).
- PR interval: usually 120–200 ms; assess for prolongation, shortening, or variability.
3) QRS Complex
Width + shape- QRS duration: narrow (< 120 ms) or wide (≥ 120 ms)?
- QRS morphology: bundle branch block pattern? ventricular rhythm features?
- Pathological Q waves: look for deep/wide Q waves in contiguous leads (interpret in context).
- R-wave progression: assess V1 → V6 (transition zone typically around V3–V4).
- Voltage screen: consider low voltage if QRS amplitudes are small across leads (definitions vary by source).
Quick low-voltage screen (as a practical check):
- At least one limb lead with R-wave amplitude > 5 mm, and
- At least one precordial lead with R-wave amplitude > 10 mm
4) Axis (Frontal Plane)
I + aVF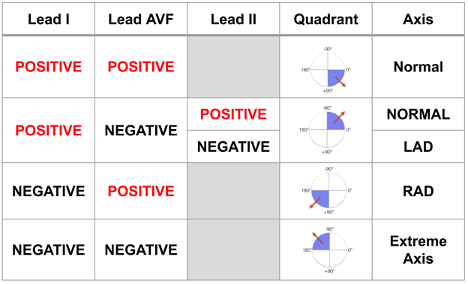
- Use leads I and aVF as a quick axis screen.
- Normal axis: QRS predominantly positive in I and aVF (common quick rule).
- If abnormal, refine using aVL/II and the overall pattern.
5) ST Segment
Contiguous leads- Assess ST for elevation, depression, or abnormal morphology.
- Measure deviation at the J point (end of QRS/start of ST) or shortly after, consistently.
- Look for changes in contiguous leads and consider reciprocal patterns.
- Remember: ST deviation can be ischaemic or non-ischaemic (context + pattern recognition).
6) T Waves
Direction + shape- Assess for inversion, hyperacute appearance, peaked, or flattening.
- T-wave direction is often (but not always) concordant with the main QRS direction.
- Check if T waves are appropriate for the lead (e.g., aVR is commonly inverted).
7) QT / QTc and U Waves
Measure cleanly- Measure QT from start of QRS to end of T wave in a clear lead (often II or V5).
- QT changes with heart rate, so QTc (rate-corrected QT) is often reported by the machine.
- Identify U waves if present (small deflection after T), and avoid confusing them with the end of the T wave.
8) Compare and Correlate Clinically
Context wins- Compare with prior ECGs when available (look for new changes).
- Correlate findings with symptoms, vitals, history, and clinical examination.
- Summarise your interpretation: rhythm + rate + key abnormalities + localisation (if relevant).