

Cardiac • 12-Lead ECG
12-Lead ECG Interpretation for Paramedics
Learn 12-lead ECG interpretation step by step — from electrode placement and lead orientation to systematic analysis, localisation, ischaemia patterns, conduction abnormalities, and common mimics.
What a 12-Lead ECG Shows
10 electrodes → 12 viewsA standard 12-lead ECG provides 12 different “views” of cardiac electrical activity using 10 electrodes: 4 limb electrodes (RA, LA, RL, LL) and 6 precordial (chest) electrodes (V1–V6).
Limb leads provide views in the frontal plane (I, II, III, aVR, aVL, aVF) and precordial leads provide views in the horizontal plane (V1–V6). Interpretation is strongest when you combine waveform analysis with lead-territory localisation.
12-Lead Quick References
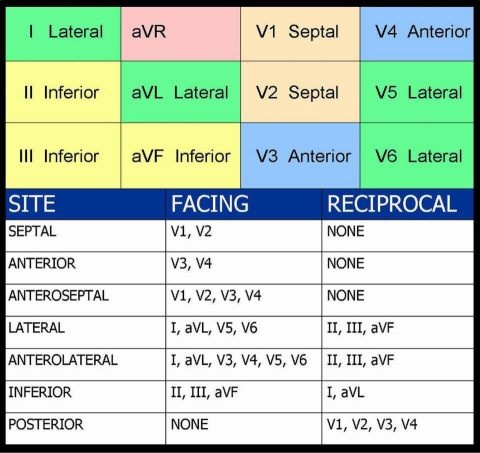
Fast visual aids you can open alongside a 12-lead for rapid review.
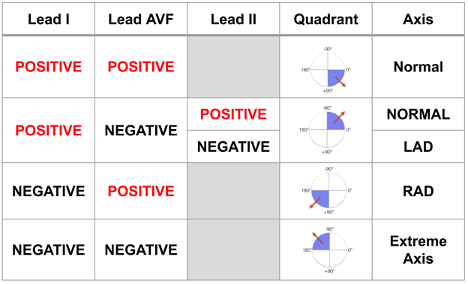
Electrical Axis
Quick reference for determining frontal plane axis using limb leads.
Quick ReferenceLearning Pathways
Work through the fundamentals, then apply a consistent interpretation method and localisation.

Getting Started
Paper speed and calibration, lead placement, artefact recognition, and core measurements including PR, QRS and QT/QTc.
Open Getting Started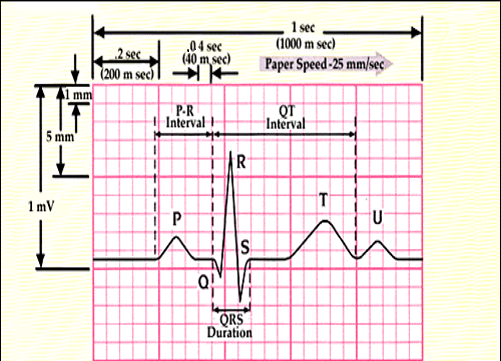
Systematic Approach
A repeatable sequence for rate, rhythm, intervals, axis, ST-T assessment, conduction and clinical correlation.
Open Systematic Approach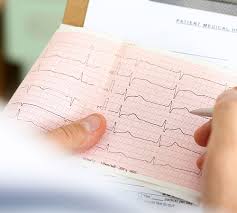
Lead Territories
Understand which leads view inferior, lateral, septal and anterior regions and how those groups support localisation.
Open Lead TerritoriesLead Groups and Localisation
Contiguous leads- Inferior: II, III, aVF
- High lateral: I, aVL
- Lateral: V5–V6 (often with I, aVL)
- Septal: V1–V2
- Anterior: V3–V4
- Posterior involvement: consider posterior leads (V7–V9) when indicated
- Right ventricular involvement: consider right-sided leads (e.g., V4R) when indicated
Ischaemia and Injury Patterns
Interpret in context- ST elevation in contiguous leads suggests an acute injury pattern; interpret in context.
- Reciprocal changes (ST depression in opposing leads) can support localisation.
- ST depression may reflect subendocardial ischaemia, reciprocal change, or other causes.
- T-wave inversion can be ischaemic or non-ischaemic — pattern recognition matters.
- Q waves may indicate prior infarction when pathological criteria are met.
Axis and Conduction
Intervals + morphology- Axis assessment using I and aVF (and aVL if needed).
- Bundle branch blocks (RBBB/LBBB) change QRS morphology and ST-T appearance.
- Fascicular blocks (e.g., LAFB) often produce axis shifts.
- QT/QTc recognition and the importance of consistent measurement.
Hypertrophy and Common Mimics
Don’t get baited- LVH/RVH patterns and their effect on ST-T segments (“strain” patterns).
- Early repolarisation as a common benign ST elevation mimic.
- Pericarditis patterns (diffuse ST elevation with PR depression) — context matters.
- Electrolytes/drugs can alter T waves, QRS width, and QT interval (high-level recognition).
- Lead placement errors can mimic pathology — always consider technical factors.