
Cardiac • ECG Fundamentals
ECG Basics: Waves, Intervals and Calibration
A practical ECG basics guide for paramedics covering paper calibration, waveform meaning, intervals and common ECG measurements. Normal ranges vary with age, sex, heart rate, and clinical context.
Quick Jump
Reference pageECG Paper and Calibration
25 mm/s • 10 mm/mV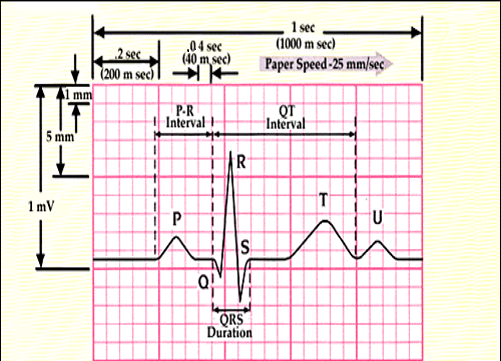
- Standard speed: 25 mm/s (most common).
- Horizontal scale (time): 1 small square = 0.04 s (40 ms); 1 large square = 0.20 s (200 ms).
- Vertical scale (voltage): 10 mm = 1 mV (so 1 mm = 0.1 mV).
- Calibration mark: typically a 1 mV “square” (10 mm tall) printed at the start of the tracing.
- Baseline / isoelectric line: the flat reference level (commonly measured using the PR segment as a reference).
What the ECG Records
Voltage vs time- Depolarization generally produces the main deflections (e.g., P wave, QRS complex).
- Repolarization produces later deflections (e.g., T wave, sometimes U wave).
- The ECG shows voltage differences between electrodes over time, not “mechanical contraction.”
- Wave direction (up/down) depends on the lead axis and the direction of electrical activity relative to that lead.
Waveforms, Segments, and Intervals
Normal features (typical)| Component | What it represents | Typical normal features |
|---|---|---|
| P wave | Atrial depolarization. |
Duration usually < 120 ms (3 small squares). Amplitude in limb leads usually ≤ 2.5 mm (0.25 mV). Often upright in I, II, aVF; typically inverted in aVR. |
| PR interval | From start of P to start of QRS: atrial depolarization + AV node/His-Purkinje conduction time. |
Usually 120–200 ms (3–5 small squares). Measured from the start of P to the start of QRS. |
| PR segment | End of P to start of QRS (AV nodal delay region). Often used as a baseline reference. | Typically near the isoelectric line (flat). |
| QRS complex | Ventricular depolarization (atrial repolarization occurs at the same time but is usually not visible). |
Duration usually < 120 ms (narrow complex). A “Q” wave is the first negative deflection; “R” is first positive; “S” is negative after an R. |
| J point | The junction between the end of the QRS and the start of the ST segment. | Reference point for assessing ST elevation/depression patterns. |
| ST segment | Early ventricular repolarization phase (plateau phase). |
Normally close to isoelectric (flat). Small, benign deviation can occur in some leads/individuals; interpret in clinical context. |
| T wave | Ventricular repolarization. |
Often upright in I, II, V3–V6; typically inverted in aVR and may be variable in V1. T wave direction is often (but not always) concordant with the main QRS direction. |
| QT interval | Start of QRS to end of T: total ventricular depolarization + repolarization time. |
QT varies with heart rate, so clinicians often use QTc (rate-corrected QT). A commonly used reference: QTc roughly < 440 ms (men), < 460 ms (women). Always interpret QT/QTc with clinical context and the method used. |
| U wave | A small deflection after T; mechanism is not always clear (often linked with repolarization phenomena). |
Usually small or absent; can be more prominent at slower heart rates. If present, it follows the T wave and is typically low amplitude. |
How to Measure (Quick Method)
Squares → millisecondsA simple, practical approach for measuring ECG intervals on standard 25 mm/s paper.
Squares → milliseconds at 25 mm/s
- 1 small square = 40 ms
- 1 large square (5 small) = 200 ms
- 5 large squares = 1 second
- Pick a clear lead. Use a lead where the waveform is well defined (often Lead II or V5 for intervals).
- Count small squares. Count from the start point to the end point, then multiply the number of small squares by 40 ms.
- Measure the PR interval. From the start of the P wave to the start of the QRS complex.
- Measure the QRS duration. From the first deflection of the QRS to the end of the last deflection.
- Measure the QT interval. From the start of the QRS to the end of the T wave. Use the clearest lead and avoid merging with a U wave if present.
Tip: If the rhythm is irregular, measure several representative
beats rather than relying on a single cycle.
Common Practical Notes
Check multiple leads- Artifact and baseline wander can distort ST/T assessment—check multiple leads.
- Heart rate affects QT; QTc is used to help compare across rates.
- Normal patterns can differ by lead; always interpret waveforms in the context of the 12-lead layout and the patient.